• Skip to main content
  • Home
  • About Turman Financial
    • About Turman Financial Group
    • John Turman
    • Eric Cheney
  • Small Business Retirement
  • Blog
  • Resources
  • Contact

Turman Financial Group

Experience. Knowledge. Commitment. Solutions, not products.

Call Us: 541-753-2262 | Client Login

Blog

February 9, 2018 by Eric Cheney

Diversification Continued

Last time we discussed why diversification was important and how it can be measured. This piece will examine some common misconceptions about diversification as well as discuss some very practical limitations.

I often have a conversation that goes something like this; “I’m well diversified because I have a portfolio of several stock funds. My funds include small stocks, mid-sized stocks, large stocks, growth stocks and value stocks.”

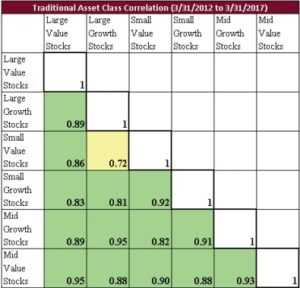
The table below shows the correlation between the various combinations of stock sizes as well as value and growth characteristics. It becomes immediately obvious that this “classic” methodology for diversifying one’s stock portfolio doesn’t really provide much systemic diversification at all! What the client is diversified from is the idiosyncratic risk of owning a single stock.  In other words, an accounting scandal at SCAM, an incompetent CEO at OOPS or a massive customer food poisoning at YUK isn’t going to significantly impact his portfolio. I consider this false sense of diversification quite dangerous as the client has a significant disconnect between their perceived portfolio risk vs. their actual risk.  The client should expect this type of stock fund portfolio to decline about the same as the general market averages, maybe even a little more since smaller stocks tend to be more volatile than large stocks!

There are better ways to diversify a stock portfolio than by simply using company size and growth/value attributes.

Another common mis understanding of diversification can occur in reviewing a client’s portfolio. As an example, a particular investment may have declined whereas their stock fund(s) are doing well. What is wrong with the laggard? Well, perhaps nothing, it may be an investment that does best when stocks are under stress. If stocks are behaving very well then it shouldn’t be a surprise that this element isn’t. Selling that poor performing investment while stocks are climbing may be regretted later when stocks actually decline. If we reduce or sell that position simply because it has declined we may be undoing the diversification element that was purposefully included in the portfolio when it was constructed. There are certainly times when an investment should be sold after a price decline but the price decline itself is not a robust reason to sell. A deeper understanding is required to make an intelligent decision. A better question to ask would be, “given the present market environment, is this element of the portfolio acting the way we expect it to”?

Diversification is sometimes referred to as the “only free lunch” in investing. This is because Modern Portfolio Theory (MPT) teaches us that effective diversification can reduce risk and increase returns!

OK so we’ve strongly suggested that diversification is a very good thing to design into a portfolio. And it is but it isn’t a silver bullet. Why?

Diversification will not prevent a loss in a down market.

In most portfolios stocks are a significant portion of the total assets. Stocks are generally the most volatile assets, their prices fluctuate more than other asset classes, and thus the majority of the portfolio risk is associated with stocks. Therefore, if stocks are in a general decline one must expect their overall portfolio value will also decline. What effective diversification can do is to reduce the magnitude of the decline. This can be tremendously beneficial. An even better scenario would be to allocated some capital to stocks whose historical returns are not strongly correlated to the general market.

Correlation Coefficients are not static.

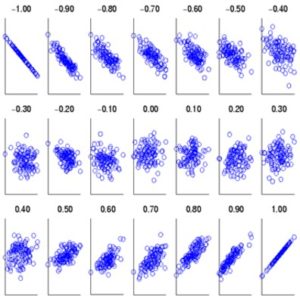
Whenever a correlation coefficient is calculated a given set of data points are analyzed. Therefore, the specific R value is dependent on the precise timeframe analyzed. This is generally not a problem.  The R for a large cap value fund may vary between 0.8 and 0.98 relative to the S&P500 but whatever the exact number turns out to be doesn’t change the fact the two are highly correlated.

In a financial crisis, all risky assets tend to decline

This is the much more troublesome reality. In a market sell-off nearly all risky assets decline simultaneously. In other words, just when you need it most the correlation between many risky assets tend to increase thus reducing the benefit of diversification. Why? In a true panic or market crisis participants change their behavior abruptly and in mass tend to sell risky assets and move their money to safety. Think lemmings and cliffs! The takeaway is that effective diversification can be a powerful tool to increase returns and decrease risk but in a declining market diversification alone cannot be expected to prevent a portfolio’s value from declining.  However, assuming your portfolio is well aligned to your risk tolerance and risk capacity hopefully you aren’t following the herd over the cliff. Instead, for the patient value investor this may represent an excellent opportunity to buy high quality assets when they go on sale!

Filed Under: Turman Financial

February 6, 2018 by Eric Cheney

Diversification; Why do we care? How is it measured?

We often discuss the benefits of diversification when it comes to investing and constructing a portfolio. However, in conversations with clients I often find there are widespread misconceptions about why diversification is desirable, how to achieve effective diversification, how diversification can be measured, as well as some of the obvious implications of having a well-diversified portfolio. In this series of blog posts, I hope to address each of these items.

Let’s start with asking the obvious question; why is a diversified portfolio desirable? The simple answer is if we knew how the future was going to play out we would simply pick the winning investment(s) ahead of time and be done with it. For example, if you knew which team would win the Super Bowl then a rational decision would be to bet your entire net worth plus whatever you could borrow on that team. Even then, though, there is a hidden risk, right? What if our counterparty (the loser) can’t or won’t pay us when our team wins? We seek to diversify since the future is uncertain. The more uncertain or the more fragile the global capital markets are the more we should consider diversification as one of our primary objectives especially if we have already accumulated a significant next egg. We need to continue to grow it, but we can’t afford to take massive losses going forward.

OK, if diversification is good since the future is always uncertain then what exactly are we attempting to diversify? The answer again is simple but powerful. We want to diversify our risk exposure. Since the future is always uncertain and all investments have risk(s) we want separate elements of our portfolio to be exposed to different risk factors. You are undoubtedly aware that high quality bonds have historically been a very good diversification vehicle relative to stocks. Why? Well stock price is typically correlated to earnings over the long term but in the short term it can be influenced greatly by events specific to that company, other companies in the same industry or the direction of the general market. High quality bond prices, on the other hand, are most impacted by changes in interest rates. At a more elemental level, stocks are a risk seeking investment whereas bonds are designed to be a safe place to park one’s capital. Those are fundamentally different risk postures; return on capital vs. return of capital. It makes intuitive sense that in a strong economy folks become more risk seeking and are more eager to invest in stocks in the expectation of high future returns whereas in a poor economy the safe harbor aspect of bonds may be more appealing. Therefore, it should not be surprising to observe that stock and bond prices often move in opposite directions. In other words, bonds have historically offered excellent diversification from stock primarily because they are subject to very different primary risk factors.

How do we measure diversification? To simplify the concept let’s take two variables (x and y) which could represent the prices of two different investments over some period. If we plot x vs y on a graph what do we see? If x and y are strongly correlated then we observe a set of points that fall very close to an upward sloping straight line. If x and y are negatively correlated the points define a line with a downward slope. If there is no correlation between x and y the data points look like a shotgun blast. Weak to moderate correlations are manifested as ovular groupings of the data as an uncorrelated circle of data points transitions to a clear linear pattern. By using some math, which we will avoid, we can quantify how well correlated the x values are to the y values. This is called the Correlation Coefficient or R for shorthand. If x and y are perfectly correlated then R = +1, if they are perfectly correlated but x increases as y decreases then R = -1. If there is no correlation whatsoever between x and y then R = 0.  The graphic below provides a visual representation of data sets whose correlation coefficient varies between minus one and plus one.

One other important feature of the correlation coefficient, R, is that it has a very useful physical interpretation between the relationship of y to x. The quantity R2, (often described as “R squared”) tells us how much of the value of Y is dependent on the value of X. For example, if r = 0.922 (highly correlated) then R2 = 0.85 which means that 85% of the value of Y is determined by the value of X while the other 15% of the value of Y has nothing to do with the value of X. Now substitute “investment 1” for “X” and “investment 2” for “Y” and it becomes readily apparent how one can quantify the degree of diversification between investment 1 and investment 2.  Specifically, an absolute value of R, |R|, of 0.4 or less means the investments are well diversified, |R| of 0.7 or greater means the investments are highly correlated (not diversified) and values in between suggest moderate correlation and diversification. Going back to our hypothetical example of an R2 0f 0.85 those two investments are highly correlated and thus do not provide meaningful diversification relative to one another. They tend to move in lockstep with one another. This is great if X is increasing in price but no investment only goes up, right?

One final important implication until next time. We obviously desire all elements of our portfolio to increase in value over our holding period which is typically many years or at least a full market cycle.  However in a well diversified portfolio we should expect that at any point in time there are some elements actually declining in price. Simply because an investment is declining in price doesn’t imply it is a bad investment. In fact, if we observe that all elements are going up at the same time rather than rejoicing maybe we should take a closer look at our holdings. We may realize that we haven’t adequately diversified our risks!

Filed Under: Turman Financial

April 13, 2017 by John Turman

1st Quarter 2017

The markets are powering forward so far in 2017.  Optimism prevails.  However the memory of 10 years ago when all seemed well and yet we were perched on the precipice of a complete market meltdown lingers.  July 2007 is when the great unravelling began:  A collectively experienced post-traumatic stress incident.       
 The corollary reaction, the desire to sidestep the “Next Big One”, is understandable.  I admit that looking back on the recent past my caution of late has been misplaced.  Hindsight; it always looks clear in hindsight.      It is a flaw in human nature to see the inevitable in retrospect and feel that we were such fools to not see “it” coming.  And of course some prognosticator always does “see it” and we marvel at their perspicacity, simultaneously feeling bad for our own lack thereof.  The big tech bust of 2000-3 and the real estate & financial meltdown of 2007-8 are so obvious, so clearly ordained to happen.   Except they weren’t.  There is no certain way things will be until they actually happen:  The 9/11 terror attacks in 2001 occurred in the middle the tech bust and had their own, far reaching, influences on future events.     
On the other hand there is predictability if you are willing to forgo timing.  The market will have a downturn of 10%, 15%, 20%, perhaps more.  This is a certainty.  When this will happen is the variable.  Three months from now; three years from now?  After the market has moved up another 25%, 50% from where it is today?  This is what we don’t know.      However, this does not mean there is no defense, or actions that can be taken.  Now would be a good time to evaluate your portfolio in relation to how you feel – your risk tolerance as it’s known.  Maybe it has changed and we should make adjustments.     
Please get in touch if you would like.  Always glad to hear from you and sit down for a chat.  Thank you for your continued business.  It is deeply appreciated. Sincere regards,
John

Filed Under: Turman Financial

January 8, 2017 by John Turman

Common Sense: Don’t Buy the Jargon

It is a reality of our daily lives that many of our endeavors are shrouded in jargon, complexity, and mystery. This is of course a natural and necessary byproduct of living in a complicated world. The terminologies for discussing computer programming, performing medical procedures, or flying an airliner (just to name a few) must be unique to themselves.

The world of finance and investing is no exception. Jargon looms at every turn: P/E ratios, Book Value, EBITDA, PEG Ratio, TTM, MRQ, Earnings Per Share (EPS), Diluted EPS, Exchange Traded Fund (ETF), Closed End Fund, No-Load Fund, and on and on and on. The mind reels at the prospect of understanding it all. It comes as no surprise then that many people hire someone to manage investments for them. But this raises a critically-important question:

Does the customer clearly understand what the person they have hired is actually doing?

If the answer is “no”, then there could be problems. This may seem contradictory. How could the customer understand what the advisor is doing if there’s so much complexity and specialized knowledge involved? After all, he’s the expert. While this is true enough, it is nonetheless my contention that the spewing of jargon can act as a smokescreen for investment professionals — or for any professionals, for that matter. If customer John Doe is overwhelmed by the sheer complexity of an advisor’s proposed plan and awestruck by his technical prowess, John may be less likely to question the process and more likely to doubt whether he can grasp the subject or have any useful input. This of course plays nicely into the hands of the professional. Needless to say, however, it’s totally wrong.

The details of investing might be complex, but the strategic overview should be transparent, rendered in plain language, and clearly understood. A deep resonating gong of “common sense” should resound in a client’s mind as an advisor is talking: “These are the portfolio strategies we are implementing…” GONG. Yes, I understand them.

“This is how we plan to implement them with your portfolio…” GONG. Yes, that makes sense to me.

“Here is how we get paid for managing your account…” GONG. Yes, that’s totally clear.

And so on and so forth for every question a client might have about how their money is going to be managed. Is it liquid? Can I withdraw funds at a moment’s notice? What are the investment expenses? How is progress monitored and reported? All these and more should have clear, unambiguous, common-sense answers.


All the best,

1387573195


Filed Under: Turman Financial Tagged With: common sense, investment strategies, jargon

December 30, 2016 by John Turman

Your Relationship with Debt

We all have a relationship with debt in some way, shape, or manner. Like other relationships in our lives, it can be complicated. Let’s examine this creature and look at some of the basics for “safe handling” of debt.

First, why would I say that we all a have relationship with debt? Well, the neighborhood school was financed with bonds, a form of debt, which determines in part how much tax you pay. In the past decade and a half there have been two major economic upheavals due in large part to debt: the 2000 tech bust which was fueled by reckless financing of internet and technology start-ups, and now the housing & real estate bust following an unsustainable bubble, also fueled by debt. These debt-fueled booms and busts in turn influence inflation, interest rates, unemployment, investment performance of your retirement accounts, property values, taxes, and more. With all of that said, even if you are debt-free and use only cash for purchases, the use of debt by others pervades your life.

With so much apparently beyond our control, what can we do? First, it’s useful to visualize your family finances as a business entity, regardless of what you actually do for a living. The goal of “Your Family, Inc.” is to increase its value (net worth) and profitability (income). What will contribute to these goals? What will hinder them? I’m going to focus here on cars and houses because these are high-value items that have a significant influence on a family’s finances.

Your automobiles

Unless you use your vehicles in a genuine money-making endeavor, they are a negative force on your balance sheet. They lose value steadily, and they cost you to insure and maintain. Having a loan on the car compounds this because you are paying interest on an object that is losing value; this increases the total cost of ownership significantly. Answer: pay cash for your ride. “What?!” you say, “I couldn’t possibly drive the car I wanted if I had to pay cash.” Exactly. Drive what you can pay cash for — not what you’ve set your heart on. There are a multitude of resources which can help you go about buying a good used car.

Now, take what you were paying on your car every month and save up to buy a rental property, or put it in your IRA, or increase your 401(k) contribution. Make a choice that has the potential for appreciation in value rather than guaranteed depreciation in value and your net worth will benefit.

Owning your home

A house is a place to live, not an investment per se. Shocking, I know. While houses can be good investments, that should not be your expectation. If you take the cost of taxes, repairs/maintenance, upgrades, interest costs on your loan, insurance and all other incidental costs of ownership, the “investment value” of your home declines dramatically.

One of the big advantages of home ownership is the effect of “fixing” the costs. Rents rise with inflation whereas the cost of your loan is fixed on a 30 or 15 year fixed loan, and as your income rises (hopefully) and inflation takes its course, your cost of ownership falls in relation to other rising expenses. So don’t go and ruin it with an adjustable rate loan, or refinancing in a way that increases the balance significantly.

The debt lesson for today: ditch the car loan to help increase Your Family, Inc.’s future net worth and “fix” the house loan to improve your profitability.

1387573195

Filed Under: Turman Financial Tagged With: appreciation, bonds, debt, depreciation, inflation

December 23, 2016 by John Turman

It’s Your Money

It’s your money. As an intelligent, enterprising person, you could manage your investments on your own, no doubt about it. However, whether you do actually manage them — or want to — is another matter entirely.

Regardless of whether you’re flying solo, using the services of an investment professional,  or both, you should be able to answer the following questions clearly and concisely:

  • What is your strategy in specific terms?
  • How is this strategy being implemented?
  • How do the items in your portfolio contribute to your strategy?
  • How are performance outcomes being monitored, reported, and acted upon?
  • How are you paying for the services?
  • Are costs and compensation clear, obvious, transparent, and specifically reported/disclosed?

Last things first…

All investments have a cost, and all portfolios cost money in some shape or manner. For instance, say that you get a “no-load” mutual fund. If you do this, you’ll avoid the initial commission a broker would charge. However, you’ll still incur all of the annual operating costs associated with the fund, which can be considerable. An overseas small company fund (typically more expensive) could push 3% per year in fees, which is a lot. Does this mean you shouldn’t own one of these investment vehicles? Of course not, but “no-load” can still equal high-cost. You need to be aware of what these costs might be.

In the same vein, let’s say you’ve owned mutual funds through a brokerage for years. You haven’t bought anything new for a while, so there appear to be no costs. Not true! Mutual funds always have ongoing costs and usually pay an ongoing commission to the broker over time, known as “trailing fees” or “trails”. The amount varies, but is often 0.25% per annum, or $250 on each $100,000 invested. Other operating costs are then added on top of this, so it’s really far from free. This is all disclosed in the fund’s prospectus, of course — which I’m sure you read cover-to-cover last time it came in the mail, right? I jest, of course.

Next item — performance. Just because a portfolio underperforms the Market for a particular interval of time does not necessarily mean that something is wrong. If it’s an even 50/50 split between stocks and bonds and you compare only to the S&P 500, it’s really not an accurate comparison. You need to compare to a 50/50 composite. Even then, this might still be a case of “apples to oranges”; however, you do need to get some sort of measure, whether you are a do-it-yourself investor or working with an advisor. At minimum, you should know the following:

  • Point-to-point (quarterly, year-to-date, etc.) returns
  • Cash inflows/outflows per quarter
  • Index comparisons; your account vs. stock & bond indices

Finally: strategy and implementation. These will vary enormously from one person, business, or entity to another. The key here is clarity and specificity, not merely “I want the account to get bigger.” Well, of course — who doesn’t? A more specific, well-defined goal would be something like, “I want my portfolio to provide financial security and an income stream for my special-needs child.” Having a concrete frame of reference will immediately start to define what kind of investment offerings should and should not be in your portfolio.

If you cannot answer these questions with relative ease, you should begin looking for answers. Give me a call/email and I’ll help you get started.


All the best,

1387573195

Filed Under: Turman Financial

Copyright © 2023 Turman Financial Group · 343 NW 7th St., Corvallis, OR 97330 · 541-753-2262 · Disclosure Statement · Privacy Policy